
NBA Player Tracking
Since the 2013-14 season, the NBA has installed special cameras in every NBA stadium allowing teams to track every single player and ball movement, and digitize it into data that their data scientists can crunch into ever more sophisticated metrics on team and player performance.
What's even more amazing is that alot of this data is now publicly accessible via stats.nba.com.
Grabbing the Data
So how do we get to the data? Screen scrapping? Nope! If you pull up the your browser's debug console, and look at the network traffic, you'll find that stats.nba.com has very kindly exposed some endpoints with for their Angular app. For example, all common info for Kobe Bryant for the 2013-14 season:
http://stats.nba.com/stats/commonplayerinfo?LeagueID=00&PlayerID=977&SeasonType=Regular+Season&Season=2013-14
Response:
{"resource":"commonplayerinfo","parameters":[{"PlayerID":977},{"LeagueID":"00"}],"resultSets":[{"name":"CommonPlayerInfo","headers":["PERSON_ID","FIRST_NAME","LAST_NAME","DISPLAY_FIRST_LAST","DISPLAY_LAST_COMMA_FIRST","DISPLAY_FI_LAST","BIRTHDATE","SCHOOL","COUNTRY","LAST_AFFILIATION","HEIGHT","WEIGHT","SEASON_EXP","JERSEY","POSITION","ROSTERSTATUS","TEAM_ID","TEAM_NAME","TEAM_ABBREVIATION","TEAM_CODE","TEAM_CITY","PLAYERCODE","FROM_YEAR","TO_YEAR","DLEAGUE_FLAG"],"rowSet":[[977,"Kobe","Bryant","Kobe Bryant","Bryant, Kobe","K. Bryant","1978-08-23T00:00:00","Lower Merion HS (PA)","USA","Lower Merion HS (PA)/USA","6-6","212",18,"24","Guard","Active",1610612747,"Lakers","LAL","lakers","Los Angeles","kobe_bryant","1996","2014","N"]]},{"name":"PlayerHeadlineStats","headers":["PLAYER_ID","PLAYER_NAME","TimeFrame","PTS","AST","REB","PIE"],"rowSet":[[977,"Kobe Bryant","2014-15",26.4,4.1,5.1,0.119]]}]}
They even expose movement data for each "play" in a game.
http://stats.nba.com/stats/locations_getmoments/?eventid={}&gameid={}
Response:
"{"moments": [[1, 1415407240007, 719.12, 24.0, null, [[-1, -1, 48.30107, 33.09853, 10.3485], [1610612761, 200768, 76.01662, 25.29939, 0.0], [1610612761, 101161, 57.58085, 29.34887, 0.0], [1610612761, 201942, 50.654, 33.00764, 0.0], [1610612761, 203082, 51.8 (...)"
Plotting Things
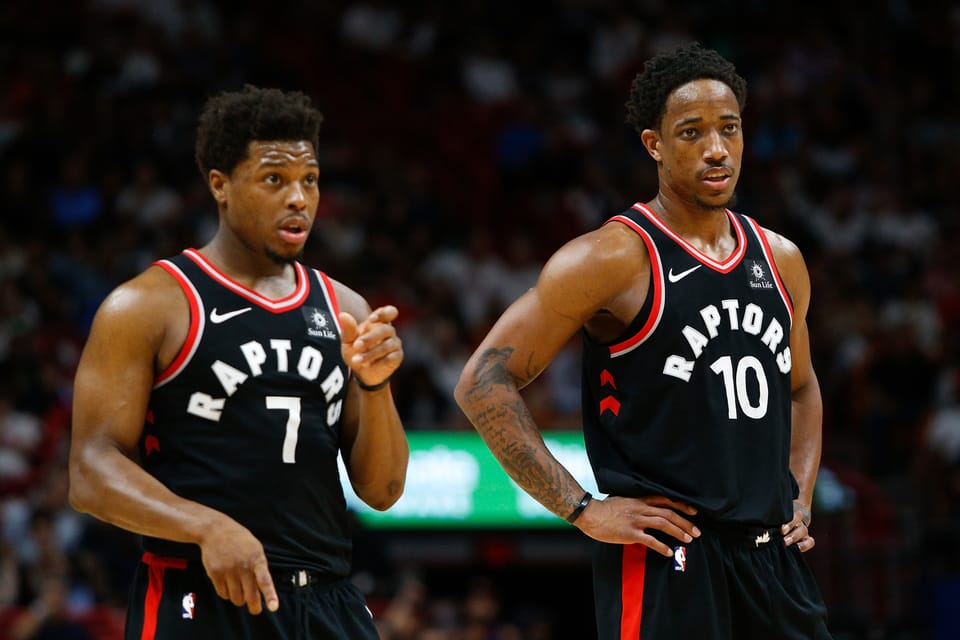
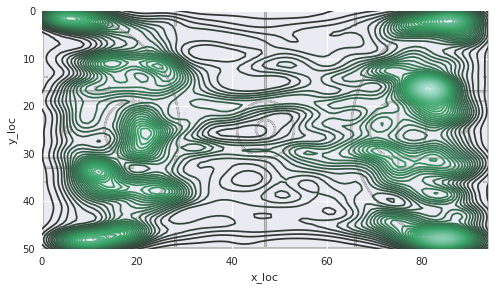
With this data we can do some cool things, like plot a density of plot of locations players tend to be. For example, lets look at this Wizards vs. Raptors game from Nov 7, 2014.
Demar Derozan
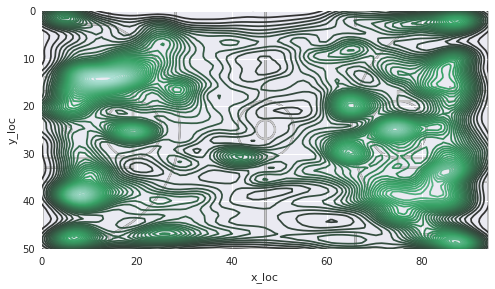
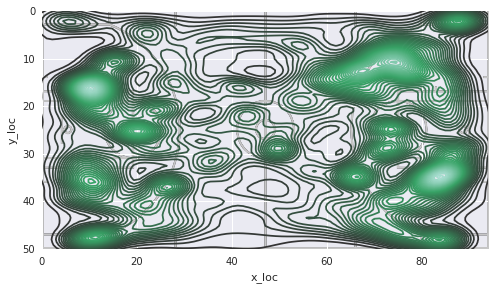
Kyle Lowry
As a point guard, his movement probably has alot of variability since he has to initiate the play.
Amir Johnson
Alot of movement down in the post, and mid-range areas as a power-forward should be.
Terence Ross
Ross loves his corner 3's
Lou Willams
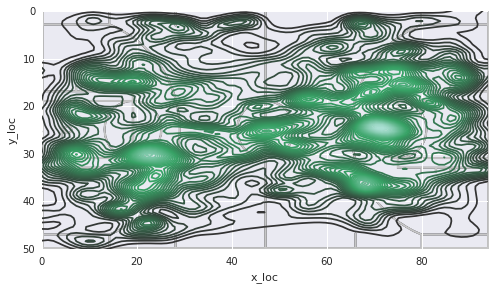
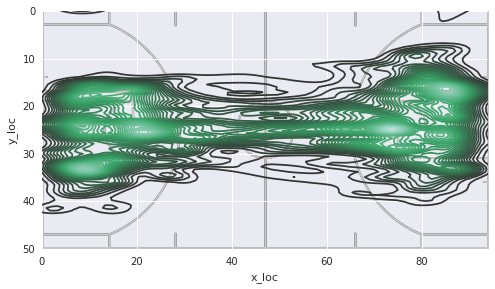
Jonas Valanciunas
Center's have a pretty simple movement pattern, move from baseline to baseline
Member discussion